M. J. Reid, K. M. Menten, X. W. Zheng, A. Brunthaler, L. Moscadelli, Y. Xu, B. Zhang, M. Sato, M. Honma, T. Hirota, K. Hachisuka, Y. K. Choi, G. A. Moellenbrock, & A. Bartkiewicz
An image of the Milky Way, taken by an observer in another galaxy, would probably
reveal a spiral structure dotted with many bright HII regions, and an "educated guess"
is that the Milky Way is a barred Sb to Sc galaxy. However, revealing the nature of this
structure has proved elusive for decades. Indeed, we do not really know the number of
spiral arms or how tightly wound is their pattern. The primary reason for the difficulty is
the lack of accurate distance measurements throughout the Galaxy.
We are now measuring trigonometric parallaxes and proper motions of sources of maser
emission associated with high-mass star forming regions, using the Very Long Baseline
Array (VLBA) and the Japanese VERA project. The long term goal is to accurately
locate most high-mass star forming regions and construct a map or plan view of the Milky
Way. The great advantage of trigonometric parallaxes is that one determines distances
directly and geometrically, with no assumptions about luminosity, extinction, metallicity,
crowding, etc. Early results from 18 sources locate several spiral arms as shown in Fig. 1.
For the Perseus arm we are able to directly measure the spiral pitch angle of 16°, which,
if constant throughout this arm and similar to other arms, favors four loosely wound over
two tightly wound arms for the Galaxy.
The parallax measurements also yield very accurate proper motions. Combining all of
the observational data yields the full 3-dimensional locations and velocity vectors of the
sources. By modeling the Milky Way as a smoothly rotating disk, we find that stars that
form in large groups on average are orbiting the Galaxy ≈ 15 km s-1 slower than expected
for circular orbits. We estimate the distance to the Galactic center is R0 = 8.4 ± 0.6 kpc.
Our data indicate that the rotation speed of the Milky Way at the radius of the Sun is
Θ0 = 254 ± 16 km s-1. We also find that the rotation curve of the Milky Way is nearly flat
or slightly rising with distance from the Galactic center.
Our rotation speed for the Milky Way is approximately 15% greater than the IAU
recommended value of 220 km s-1. The implications for increasing the rotation speed
of the Milky Way are profound. It reduces kinematic distances by ≈ 15%, which can
affect estimates of sizes (by 15%), luminosities (by 30%), and masses (by up to 50%).
Interestingly, the rotational properties of the Milky Way are nearly identical to those of
the Andromeda galaxy (M31) as shown in Fig. 2. The most straightforward interpretation
of the similarities of the rotation curves for the Milky Way and Andromeda is that these
two galaxies, which dominate the Local Group, are nearly equal in size and mass. Thus,
the MilkyWay should probably not be considered the little sister of the Andromeda galaxy;
the two galaxies are more like fraternal twins.
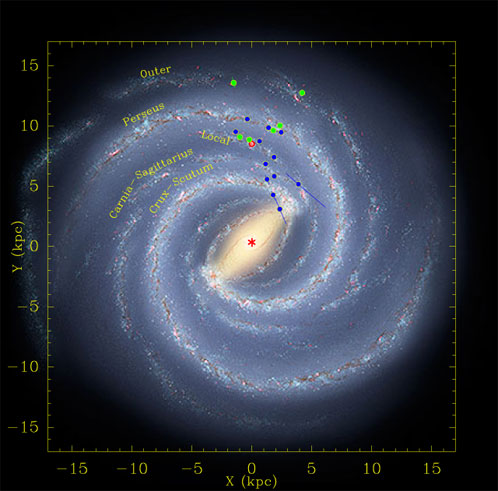
Figure 1: Locations of high-mass star forming regions for which trigonometric parallaxes have
been measured. Parallaxes from 12 GHz methanol masers are indicated with dark blue
dots and those from H2O and SiO masers or continuum emission (Orion) are indicated
with light green dots. Distance error bars are indicated, but most are smaller than the dots.
The Galactic center (red asterisk) is at (0,0) and the Sun (red Sun symbol) at (0,8.5). The
background is an artist’s conception of Milky Way (R. Hurt: NASA/JPL-Caltech/SSC)
viewed from the NGP from which the Galaxy rotates clockwise. The artist’s image has
been scaled to place the HMSFRs in the spiral arms.
 Zoom
Zoom
Figure 2: Rotation speed versus radius for the Andromeda galaxy and the Milky Way. The red
squares are based on HI observations of Andromeda tabulated by Carignan et al. (2006, ApJ,
641, L109). The blue filled circle is our best estimate of Θ0 = 254 ± 16 km s-1 at R0 = 8.4 kpc for
the Milky Way, derived from the parallax and proper motions of high mass star forming
regions. The blue dot-dashed line is for a flat rotation curve, and the blue dashed line corresponds
to a slightly rising rotation curve of 2.3 km s−1 kpc−1. These lines are plotted over the
range of Galactocentric radii sampled by the parallax and proper motion results. Note
that these two galaxies have nearly identical rotation speeds over this range.
Zoom
