The Relic in Abell 85
Description
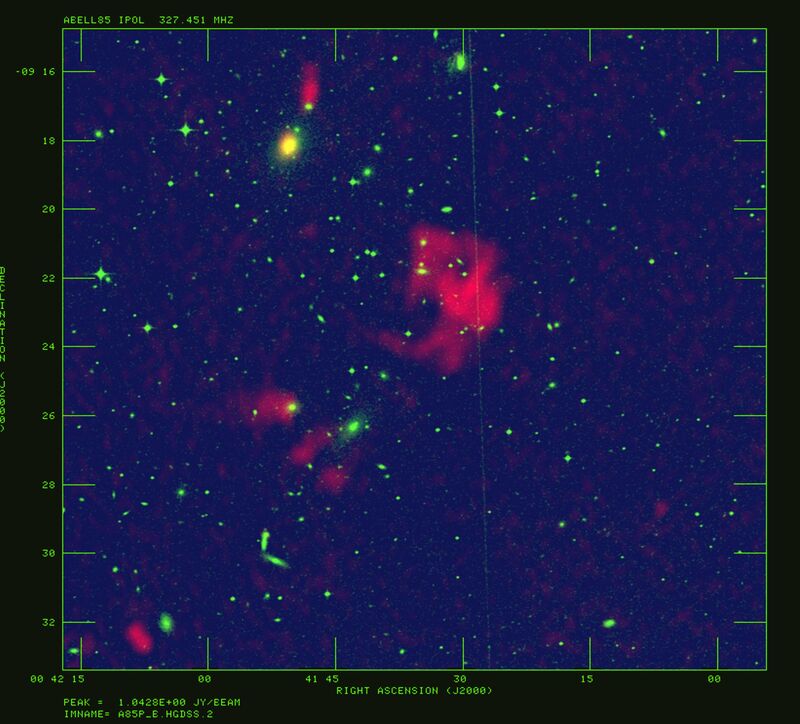
This is a spectral index map of the cluster of galaxies Abell 85. Within this cluster are several radio galaxies, some of which are young, and one of which is considered a relic (the largest red structure). This radio relic contains old radio plasma which may come from one or more radio galaxies. The significance of this spectral index map is that it is the combination of two radio frequency observation (90 cm and 20 cm). Red represents the material with the steepest spectral index (the oldest material), and green represents material with the flattest spectral index (the youngest material). The filamentary material in the relic is yellow (flatter than the surrouding diffuse relic material}.
The relic in Abell 85 goes by the name of 0038-096 and has been classified as a Very Steep Spectrum Radio Source (VSSRS). It is probably no accident that the relic is located on the peripheries of the cluster. Radio plasma located near the center of a cluster will suffer much greater radiative losses due to higher B-fields for regions of higher pressure. The source was observed from July 2000 to August 2001 in both B1950 and J2000 coordinates. The bandwidth was 3.13 MHz at 90 cm, 25 MHz and 50 MHz at 20 cm. The final maps are at a resolution of 5.5'', 14'', and 22'' for Abell 85. The 400 cm data at C array for Abell 85 was also processed and reduced. However, there was no need to combine this data set with the A and B arrays since matching the resolutions and UV coverage with the 90 cm and 20 cm map would necessitate the loss of the short UV spacings. The 90 cm data at A array was spectrally averaged down to 3 channels, while the B, C, and D array were spectrally averaged down to 4 channels. In order to combine all 4 arrays, the data from each array were summed into a continuum data set then added together using DBCON. Only L1 was used for the spectral analysis for Abell 85. One of three observing periods at L1 was corrupt and was not included as part of the analysis. I used IMAGR as the primary imaging algorithm. In imaging the 90 cm data, it was necessary to employ the wide field imaging technique (as described in Chapter 2). For the 90 cm data at A array, I imaged 200 fields. The inner field was cleaned out to a radius of one degree and an NVSS search for outlier point sources was conducted out to a radius of 10 degrees. Integration times. 90 cm A array: 4.43 hours B array: 2.34 hours C array: 1.4 hours D array: 0.42 hours 20 cm C array: 3.46 hours D Array 0.74 hours All 27 antennas were used during the time of the observations.
Creator
Legacy Astronomical Images
Rights
NRAO/AUI/NSF does not hold full copyright for this image. Contact the archivist for details.
Type
Legacy Astronomical Image
Object Name
Abell 85
Photo Credit
Andrew Young
Investigators
Andrew Young, Lawrence Rudnick, Heinz Andernach, Tracey DeLaney, Namir Kassim
Telescope
Very Large Array (VLA)
Observation Date
2001-08-30
Type of Observation
continuum
Band
P
Wavelength
90 cm
Frequency
330 MHz
Center of Image
RA 0:41:30.000, Dec: -9:21:30.000 (J2000)
Field of View
0.166667 x 0.250000 degrees
Notes
Contact the archivist for a high resolution tif of this image.
Series
Active Galactic Nuclei Series
Unit
Radio Galaxies Unit
Citation
Legacy Astronomical Images, “The Relic in Abell 85,” NRAO/AUI Archives, accessed June 13, 2025, https://www.nrao.edu/archives/items/show/33381.

