NRAO eNews
June 2008 • Vol. 1, Iss. 1
- The Birth of a Supernova
- ALMA Construction Continues
- GUPPI First Light
- GBT Dynamic Scheduling System Beta Release
- EVLA Progress
- Observing with the VLA-EVLA Transition Array
- NRAO Data Vault Available
- VLBA Principal Scientist Appointed
- The GBT Supports the Phoenix Mars Lander Mission
- Satellite Downlink Coordination & the Phoenix Mission
- The Pete V. Domenici Science Operations Center
- NRAO Scholarships Awarded
- ALMA Presentations in Chile
- Archive
- Contact the Editor
- Subscribe
- More Information
NRAO eNews: June 2008 • Volume 1, Issue 1
The Birth of a Supernova
Supernovae represent the explosive death of the most massive stars in the Universe. They live fast and die young, often within just a few million years. These explosions give birth to neutron stars and black holes, and fuel galaxy evolution through the injection of heavy elements and mechanical energy. Indeed, much of the material in the Solar System and on Earth was forged, processed, and dispersed by supernovae and their progenitor stars.
The basic picture of a supernova explosion involves the collapse of the iron core at the end of the star's life. The collapsing core reaches nuclear densities within tens of milliseconds and then rebounds, generating a shock wave that eventually blows up the star. The details of the mechanism, however, remain highly uncertain, and even the most sophisticated numerical simulations fail to generate a clear explosion.
The explosion also leads to the synthesis of new elements. Of particular importance is nickel-56 whose radioactive decay gives rise to bright optical emission — the hallmark of supernova explosions. The optical light becomes progressively brighter, reaching a peak about two weeks after the explosion. Since supernovae are invariably discovered through their optical emission, they are generally found days to weeks after the actual explosion when most of the fireworks are already over.
However, it has long been predicted that the most extraordinary and luminous component of a supernova explosion is actually an intense and short-lived X-ray outburst at the moment that the shock wave rips the star apart, the so-called "break out" emission. Unfortunately, since such a transient signal is incredibly hard to detect, this X-ray signature has never been observed. As a result, no supernova has ever been seen at the time of explosion. We therefore lack an understanding of the first minutes, hours, and days in the evolution of supernovae.
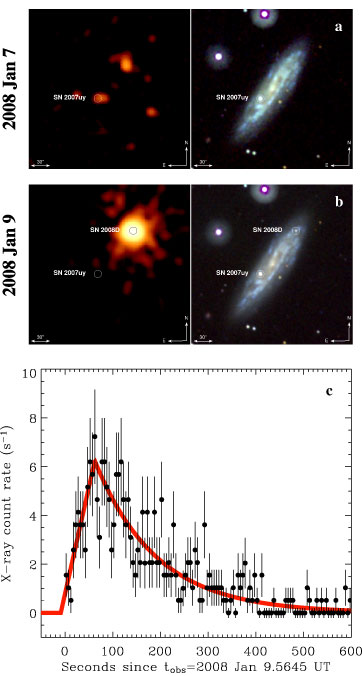
All of this changed dramatically on January 9 of this year when we essentially won the astronomers' lottery. During our brief observation of a supernova in the nearby galaxy, NGC 2770 (d = 27 Mpc) with Swift's X-ray Telescope (XRT), another star in the same galaxy exploded. The explosion was marked by an extremely luminous X-ray outburst, Lx ≈ 1044 erg s-1, lasting just a few minutes. Thanks to a stroke of good luck, we serendipitously recorded the whole event from start-to-finish with the XRT.
Swift's co-aligned Ultra-Violet Optical Telescope (UVOT) did not detect an optical counterpart contemporaneous with the X-ray outburst, but just two hours later it spotted a new optical source rising quickly in brightness. Through optical spectroscopy we quickly established that the nature of the transient was a very young supernova. In particular, the lack of hydrogen and silicon lines in the spectrum marked the event as a Type Ibc supernova (SN Ibc), which was thereafter, designated SN 2008D. The phenomenal X-ray outburst can therefore be interpreted as the long-awaited confirmation and first-ever detection of shock break out emission from a newborn supernova explosion.
However, it is also interesting to note that about 1 in every 1000 SNe Ibc gives rise to a gamma-ray burst (GRB) or an X-ray Flash (XRF). The hallmark of GRBs and XRFs are their ultra-relativistic outflows (bulk Lorentz factor, γ ~ 100), collimated into extremely narrow jets, and to which about 1051 erg is coupled. Given the extraordinary X-ray outburst we saw from Type Ibc 2008D, it is natural to question whether the high-energy emission could be attributed to a relativistic GRB or XRF outflow.
Radio observations are the only way to address this question since they uniquely measure the energetics and geometry of the fastest material ejected in supernova explosions. These fast ejecta race out ahead of the slower bulk stellar debris and shock-accelerate electrons in the supernova's immediate environment. Synchrotron emission is produced as the electrons gyrate in amplified magnetic fields. By monitoring the evolution of the synchrotron emission, the properties of the fastest ejecta and the density of the environment are directly revealed.
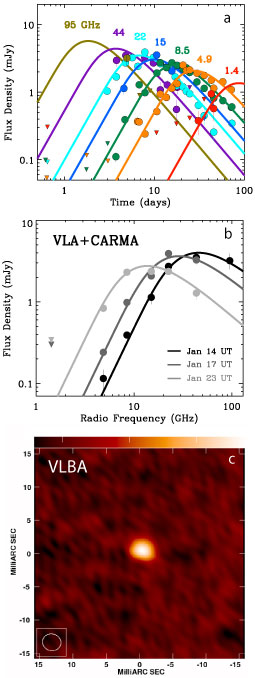
To determine the nature of the X-ray outburst of SN 2008D — shock break out emission or relativistic outflow — we initiated a dedicated monitoring campaign with the VLA and CARMA beginning just hours after the X-ray outburst. Shortly thereafter, we detected a new radio source that grew in intensity over the next few weeks. Our densely sampled observations spanning 1.4 to 95 GHz are shown in Figure 2.
Twenty days after the outburst, the radio emission peaked at 8.46 GHz with radio spectral luminosity of 1027 erg s-1 Hz-1, a factor of 104 lower than those of typical GRB afterglows, but comparable to the radio luminosities observed for nearby core-collapse SNe. Based on our modeling of the temporal and spectral evolution of the radio emission, we firmly constrain the velocity of the fastest ejecta to be just υ =0.25c with a kinetic energy 1048 erg, or 0.1% of the total kinetic energy of the explosion. As a result, this explosion bears no resemblance to the extraordinary energetics and velocities inferred for GRBs and XRFs. The radio emission thus points to an ordinary core-collapse supernova in which only a tiny fraction of the explosion energy is coupled to fast ejecta.
Of course, the ultimate clincher in constraining the expansion speed of the ejecta is through direct measurements with VLBI since it may enable us to actually resolve the ejecta. Along this line, we obtained VLBA observations of SN 2008D at one month after the explosion (Figure 2). While the relativistic ejecta from a GRB or XRF would be easily resolved in this observation, the non-relativistic material from an ordinary supernova would be far too small. We show that the ejecta are not resolved in the VLBA map, imposing a conservative upper limit on the speed of the fastest ejecta to be γ ≈ 3. We further note that these observations rule out the possibility of a relativistic jet pointed away from our line-of-sight.
In conclusion, our radio observations have enabled us to distinguish the nature of the SN 2008D X-ray outburst. As we report in a recent paper to Nature, every aspect of the supernova was fully in line with expectations for an ordinary core-collapse explosion. The X-ray outburst is well described by the long predicted, but not yet seen, shock break out emission, and we clearly rule out any contribution from an associated GRB or XRF.
The most exciting conclusion of this study is that SN 2008D was a perfectly ordinary supernova caught in the act of exploding. We can therefore expect that all ordinary supernova produce a similarly spectacular X-ray outburst marking the time of explosion and that this may be used as an early warning beacon to enable follow-up from ground based facilities enabling searches for neutrino and gravitation wave signatures, which may ultimately unravel the mystery of supernova explosions. Looking forward, the field of supernova discovery and study is on the brink of a paradigm shift. When the next generation of X-ray satellites are deployed (e.g. EXIST), we predict that hundreds of supernovae will be discovered each year by observing their powerful X-ray outbursts.
Alicia Soderberg (Hubble / Carnegie-Princeton Fellow, Princeton Astrophysics and Carnegie Observatories)
References:
Soderberg et al., 2008, Nature, 453, 469 (arxiv:0802.1712)
ALMA Construction Continues
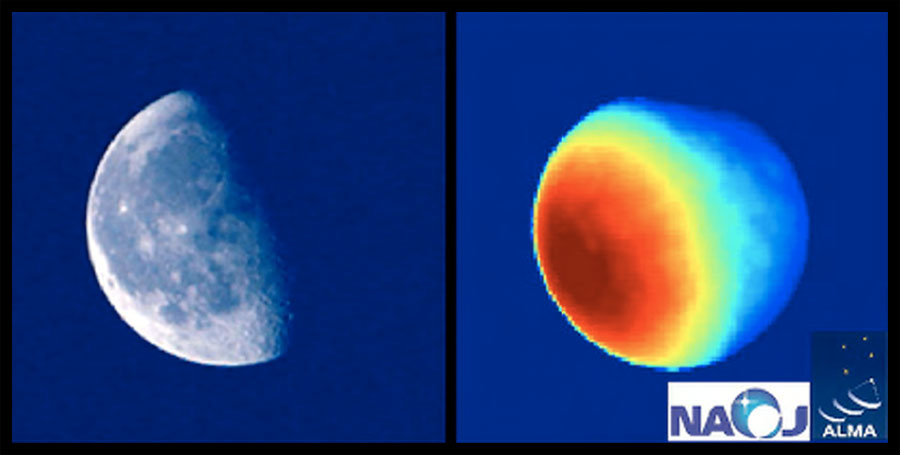
Figure 1. (Left) An optical image of the Moon on Feb 27, 2008. (Right) An image at 147 GHz made with a Melco antenna. Zoom
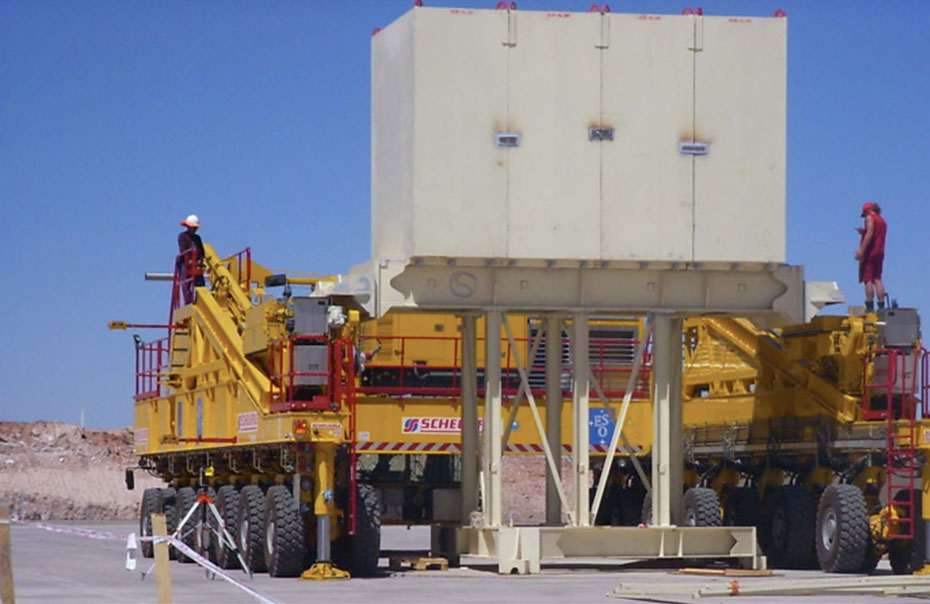
Figure 2. An ALMA transporter lifts a dummy load designed to mimic the mass of an antenna. Zoom
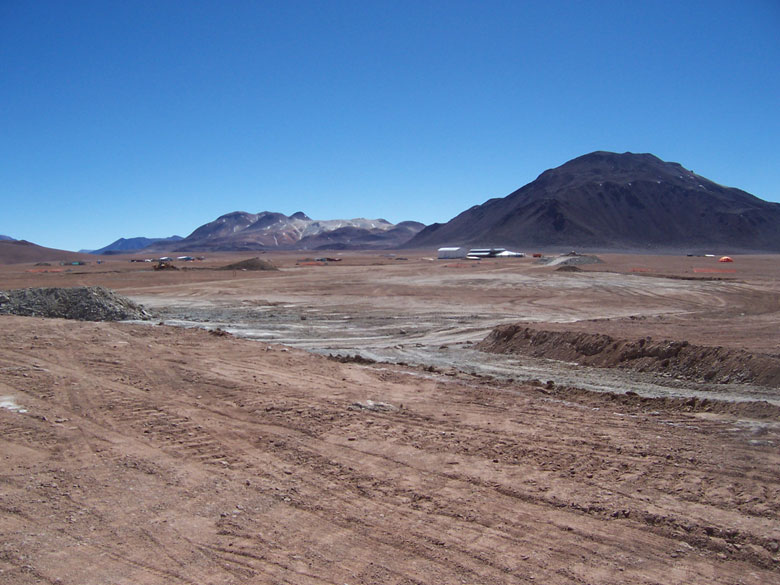
Figure 3. Antenna station excavation has begun at the center of the array at the 16,400-foot level. The Array Operations Building is in the background; the newly completed transporter shelter is to its left. Zoom
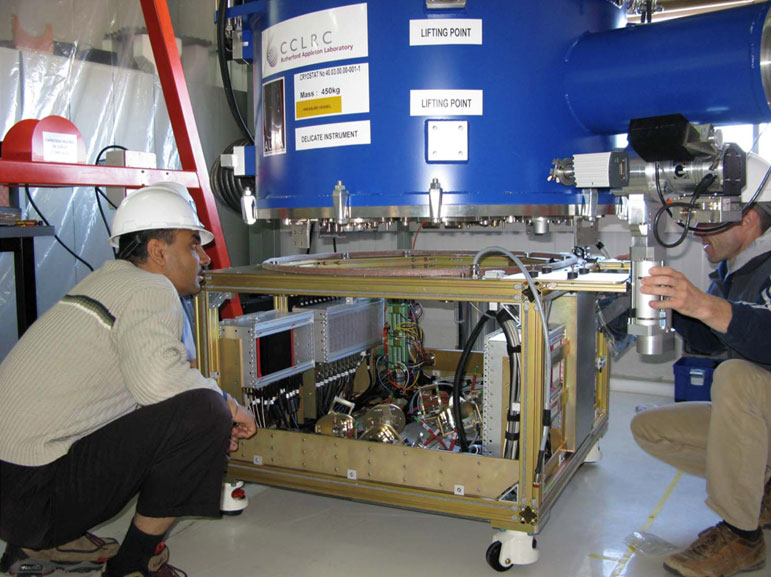
Figure 4. The first ALMA Front End undergoes provisional acceptance at the OSF in May. The sensitive detectors are in the large blue dewar, which keeps them temperature stable at near absolute zero. Zoom
Figure 5. Spectrum acquired with the prototype ALMA system at the ALMA Test Facility towards the Orion hot core. Lines are labeled to identify the emitting species. Zoom
This quarter marks the tenth anniversary of the approval by the National Science Board of the ALMA Design and Development program, which led to the provisional acceptance of the first prototype antenna from VertexRSI in March 2003. As of June, there are nine production ALMA antennas in Chile, including five production 12m antennas from VertexRSI and four from Mitsubishi Electric Co. (Melco). Several of these antennas are undergoing tests that should lead to acceptance of the antennas from the contractors in the coming months. Using a special receiver operating at 2 mm wavelength, a Melco antenna imaged the Moon in March (Figure 1).
The first accepted antenna will be tested at the 16,400 foot Array Operations Site (AOS) near the Technical Building toward the end of the southern hemisphere summer. The antenna will be transported there by the massive transporters, which are concluding their tests and should be accepted by the project over the northern hemisphere summer.
The first ALMA production Front End has been delivered to Chile from the North American Front End Integration Center in Charlottesville. This package contains electronics for collecting the faint signals from the sky. It will undergo provisional acceptance in Chile at the Operations Support Facility (OSF). The Front End has now been integrated by the Assembly, Integration and Verification team at the OSF with the antenna-based part of the Back End, and the two-antenna correlation and system software, to produce a spectral density plot over a 2 GHz band for the first end-to-end test of these combined units. The members of the Front End IPT from Charlottesville at the site were: Christian Holmstedt, Andrea Vaccari, Denis Urbain, Morgan McLeod, Antonio Perfetto, and Kamaljet Saini.
At the ALMA Test Facility in New Mexico, the prototype system is routinely producing observations. ALMA scheduling scripts direct observations, which are executed to produce data in typical fashion, including sequential observation of calibrator sources and targets. Data are then transferred from the archive to the standard ALMA data format. Data may then be inspected using the 'Quick Look' software, and imported into the CASA software for advanced processing. An example of a calibrated spectrum of the Orion hot core is shown in Figure 5; the sensitivity approximates that of the Turner (1989) spectral survey of Orion. For a more sensitive view of this portion of the spectrum, see the M. Guelin et al. article in the newly published volume Science with the Atacama Large Millimeter Array: A New Era for Astrophysics.
Dr. A. Beasley has left ALMA to pursue other interests; Dr. Tetsuo Hasegawa assumed the duties of ALMA Project Manager in May.
Al Wootten
GUPPI First Light
On April 17, the team working on the new GBT pulsar backend as part of the CICADA project (Configurable Instrument Collaboration for Agile Data Acquisition) achieved first light with GUPPI (Green Bank Ultimate Pulsar Processing Instrument). GUPPI is based on the open-source FPGA-based technologies developed by the CASPER group at U.C. Berkeley. A large number of NRAO staff members, students, and university collaborators have contributed to GUPPI since it was first proposed at the Green Bank Future Instrumentation Workshop in fall 2006. However, most of the effort has come only in the last 8 months from a smaller team: John Ford (Project Manager), Randy McCullough (Project Engineer), Scott Ransom (Project Scientist), Patrick Brandt, Paul Demorest, Ron DuPlain, Glen Langston, and Jason Ray.
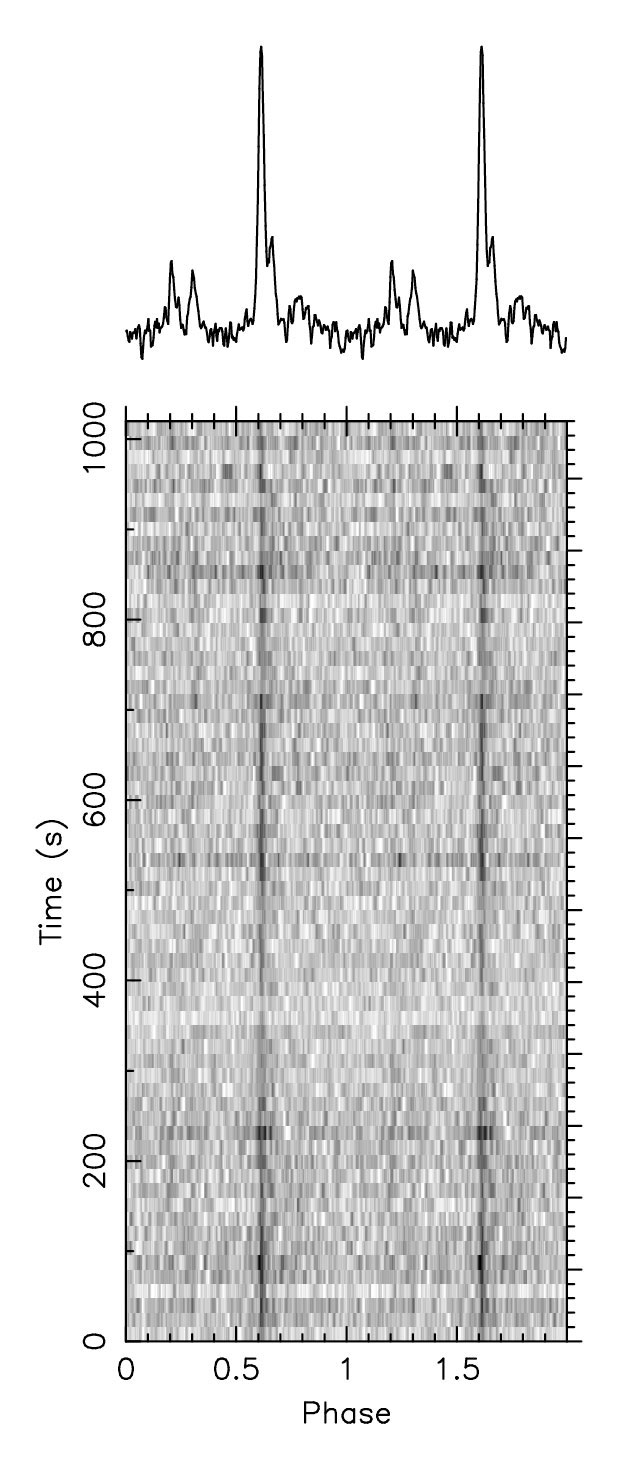
In its first-light configuration, GUPPI already had more time and frequency resolution than the GBT Spigot, and output all four Stokes parameters as well, for a data rate of 190 MB/s! While GUPPI was configured to process 400 MHz of bandwidth via 8-bit sampling, the observations were made with the Green Bank 43-m telescope and an IF that passed only 200 MHz of bandwidth centered at 2 GHz. The target (see Figure) was the "young" 3-ms millisecond pulsar in the globular cluster M28 known as PSR B1821-24 (or M28A). With its large dispersion measure and complex pulse profile, it is a difficult target for conventional filterbank-style pulsar backends, but GUPPI's detection looks fantastic.
Over the next 1-2 months, GUPPI will be used for several expert-user observations in its "Phase I" configuration which will eventually replace the GBT Spigot: 2048 or 4096 channels over 800 MHz of bandwidth with either total intensity or Full Stokes output. Meanwhile, work will continue on GUPPI "Phase II", which will be a wide-bandwidth (500-800 MHz) coherent-dedispersion backend built for high-precision and high-sensitivity pulsar timing observations.
Scott M. Ransom
GBT Dynamic Scheduling System Beta Release
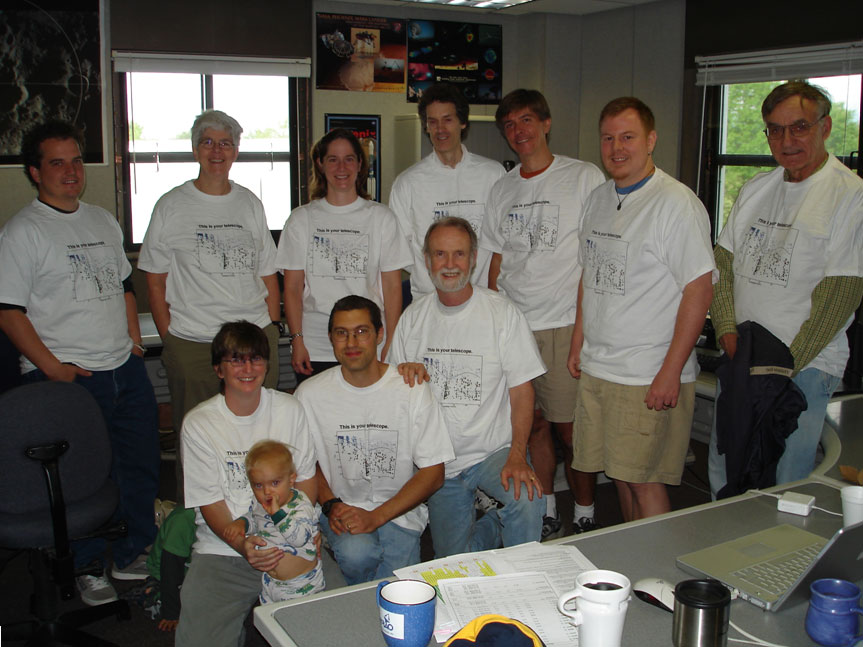
The GBT DSS team (clockwise from top left): Larry Morgan, Jules Harnett, Amy Shelton, Dana Balser, Jim Braatz, Mike McCarty, Carl Bignell, Mark Clark, Paul Marganian, and Karen O’Neil. Team ‘helpers’ Willie and Max O’Ganian are at bottom left (Max is hidden). Team members missing from the photo: Jim Condon, Eric Sessoms.
The first schedule of the Green Bank Telescope’s prototype Dynamic Scheduling System (DSS) was made June 1, 2008. The GBT will be scheduled using the DSS for the 08B trimester (June 1 - Sept 30, 2008). After September 30, the telescope will revert back to its previous scheduling system until the full release of the DSS (currently planned for summer 2009). User feedback from the beta test will allow the DSS team to ensure that the system will be readily usable by all GBT observers when the system is fully deployed.
The goal of the DSS is to maximize the observing efficiency of the telescope while ensuring that none of the flexibility and ease of use of the GBT is harmed and the data quality of observations is not adversely affected. The DSS works by breaking each project into one or more sessions. Project sessions have associated observing criteria such as RA, Dec, frequency, receiver. Observers may also enter dates when members of their team will not be available for either on-site or remote observing. The scheduling algorithm uses those data, along with the predicted weather, to determine the most efficient schedule for the GBT. The DSS provides all observers at least 24 hours notice of their upcoming observing. In the uncommon (< 20%) case where the predictions do not match the actual weather, a backup project, chosen from the database, will be run instead.
The majority of the DSS team met in the control room on Sunday morning, June 1 to release the first schedule (Figure 1). Overall the event went extremely smoothly, with the total time from initial release of the system to publishing the schedule being less than 1.5 hours. The system is now up and running, with GBT telescope schedules being built daily and weather checks of the schedule being made throughout the day.
Details of the DSS and access to the system are available on-line. The website contains an introduction to the DSS, which includes an overview of the information needed by the DSS to schedule a project, as well as a tutorial on using the system and a section of frequently asked questions. There are also links to the DSS help desk and to a chat facility for online help.
Karen O'Neil
EVLA Progress
Antennas continue to be retrofitted to the EVLA design at the rate of six antennas per year. A total of 15 antennas are now used in scientific observations and account for 52.9% of all antenna hours used in observations. The electronics outfitting of the 16th antenna is underway, and the mechanical overhaul of the 17th antenna has begun.
Preparations are underway for the arrival and initial testing of the first parts of the WIDAR correlator. A 4-station prototype correlator (PTC) will be installed in June, and prototype tests will be conducted through September 2008. The racks and cables for the full correlator will be installed in May through September. Limited observing with a 10-station correlator will commence in October. Access, cleanliness, and electrostatic discharge procedures will be implemented in the correlator shielded room in early October. The humidity control features of the HVAC units in the correlator shielded room were placed in operation in March 2008.
In Penticton, British Columbia, extensive tests of the "stage 2" prototypes for the correlator’s station and baseline board have been conducted. The station board provides delay tracking and digital filtering for the correlator. The baseline board contains the correlator chips where the correlations are computed. The final design of the station board was approved, and the "stage 3" build of 14 station boards was completed. Testing of the baseline board is still underway and has gone very well. The board is functioning as designed. However, some bugs have been encountered in the baseline board, and this has delayed the approval of the design for its next stage build. The delay with the baseline boards does not delay critical on-the-sky tests with the PTC in June, as the existing stage 2 baseline boards can be used.
The correlator chip manufacturer, iSine, delivered the production order of 12,000 chips to Penticton by mid-April 2008. The qualification testing of a subset of these chips was completed by MuAnalysis, a company that specializes in industry-standard qualification, failure analysis, and screen testing of integrated circuits.
Work has progressed on the monitor and control software needed for PTC tests in June. A document describing the software needed for both the PTC and the 10-station early WIDAR was started. A startup sequencer and a related graphical user interface for setting it up were created for the WIDAR baseline boards. The design and implementation of the Test Builder and Test Executor were started. This software will be necessary to set up the PTC for testing. An agreement between ALMA and EVLA on the binary data format (BDF) has been written. Existing code will be modified to write this version of the BDF. The writing of the minimal version of the Science Data Model (SDM) that will be needed for PTC testing has progressed to the point where real SDMs are being written to disk given current input on what the VLA is doing.
The EVLA antennas currently in the array use the EVLA’s narrowband (1 GHz) signal path. The full capability of the EVLA’s wideband (2 GHz) signal path cannot be exploited until the arrival of the WIDAR correlator. The first T304 baseband converter modules to be fully configured with wideband electronics are now being produced. The parts needed for the wideband path, such as the gain-slope equalizers and wideband filters, have been received and are now being included in the regular production build. The wideband upgrade of existing T304 modules will commence this summer.
Some LO/IF modules have not met phase stability requirements because of thermal effects in the modules. The phase stability of these modules is being improved by adding thermal mass and by replacing existing module cables with cables that are less sensitive to temperature variations. Investigations into module phase stability will continue in an attempt to identify any other problems, particularly in the course of testing the wideband signal path with the new correlator.
Work continues on studying the unexplained relationship between the phase of the antenna signal and antenna elevation. A more suitable signal injection technique was implemented to produce faster and more repeatable results during antenna testing. Laboratory tests were completed on modules in the data transmission system to eliminate the digitizers as a potential cause. Another test was run to exonerate the system software and VLA correlator. These tests confirmed that the issue is indeed in the antenna portion of the LO/IF electronics system. Tests are currently concentrating on the thermal behavior of the LO comb generator (a commercial product) and a circuit board in the downconverters.
The prototype Ka-band (26-40 GHz) receiver was shown to meet project specifications and was installed in antenna 4 on May 22. Fringes were recorded with this receiver by tuning it and the Q-band (40-50 GHz) receivers in the other antennas in the array to a frequency of 40 GHz. The installation of this prototype receiver was delayed due to unexpected conversion loss in its downconverter. The mass production of the Ka-band receiver will commence in Q3 2008.
Although the prototype C-band (4-8 GHz) orthomode transducer (OMT) met project specifications, its assembly and adjustment proved to be too time consuming. The mechanical design of the OMT was refined to simplify its assembly. Now, no adjustments are required after assembly for the device to meet its performance specifications.
The C-band OMT is combined with a 90-degree hybrid coupler to convert linear polarization into circular. This technique requires the cables between the OMT and hybrid to be phase-matched. Staff in the front end group were recently successful in accomplishing the phase-matching task. They also selected a hybrid that functions reliably at cryogenic temperatures.
In February 2008, production orders were placed for the S-band (2-4 GHz) feed horn’s centrifugal castings and fiberglass lamination. The production lamination of the S-band horns started in April. The horns will be assembled at the rate of two every seven weeks. The fabrication of the aluminum rings for the S-band horns continues at the VLA site.
Recent work on software for the EVLA’s Science Support Systems (SSS) has focused on the Observation Preparation Tool (OPT). An expert-user interface for manipulating the EVLA antenna electronics was made available within the OPT. Users who do not wish to deal with the instrument at such a detailed level will be shielded from this part of the application. Expert users, though, will be able to tune each local oscillator independently and will eventually have access to all hardware switches. The OPT was augmented in two other areas. The first augmentation was the creation of a summary tab for scheduling blocks that shows a listing of the scans in that block. To support this tab, an underlying model that includes the EVLA telescope motion model and celestial coordinate conversions had to be updated. The second augmentation was the addition of software that converts the project model into a script of commands (in the jython scripting language) that can be understood by the current observation executor. This ability is in the prototype stage and can currently handle only the simplest of observations.
Work has progressed on adding a model and user interface for the VLA correlator to the SSS software to support Ka-band observing on the VLA. The user interface will be similar to the one in the Proposal Submission Tool (PST). Scientists reviewed the interface, and their suggestions are being implemented in an updated version.
As recommended by the EVLA Advisory Committee and the AUI Visiting Committee, an integrated schedule was developed to illustrate how the EVLA construction project transitions to operations. The schedule shows how the required software and hardware come together in preparation for the first shared risk science observations with the new telescope. The schedule was used to develop an EVLA capabilities forecast.
M. M. McKinnon and the EVLA Project Team
Observing with the VLA-EVLA Transition Array
Work to find a post-processing solution to the aliasing problem, which primarily affects the narrower spectral line bandwidths, is continuing. Please consult the special aliasing section on the EVLA returns page for the latest news.
Small frequency differences, as encountered when using online Doppler tracking, have been known to cause phase jumps on VLA - EVLA baselines for some time, and we have been strongly advising against the use of Doppler tracking whenever crossed (VLA - EVLA) baselines are required. As reported in the April 2008 NRAO Newsletter, we discovered some time after the Modcomps were retired that, when Doppler tracking, the phase did not remain constant when moving from one source to another nearby source. The small frequency change caused by moving from source to nearby source caused a large phase shift, which would make it impossible to copy calibrator phase solutions to a nearby source. This affected all baselines, and we temporarily had to advise against any use of Doppler tracking. As of April 9, 2008, this problem was resolved, and Doppler tracking should work again for VLA - VLA and EVLA - EVLA baselines. For crossed baselines, however, use of Doppler tracking remains strongly discouraged.
It was recently discovered that spectral line observations taken at 12.5 MHz bandwidth in most cases show a noise level too high by a factor of at least 2. We are currently determining when this problem started to occur. We did discover that by turning off the so-called correlator self- test this problem goes away, and we plan to turn off self-test by default whenever 12.5 MHz bandwidth spectral line observations are requested.
For the latest news on these and other EVLA related items, please consult our EVLA returns web page.
Gustaaf van Moorsel
NRAO Data Vault Available
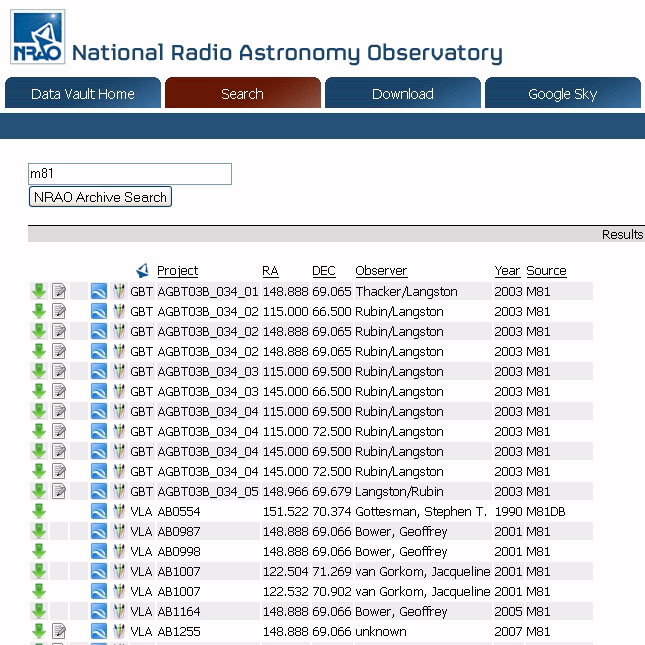
Users of NRAO telescopes now have more options to find relevant data in the NRAO archive with the release of the “Data Vault” interfaces. The new features were selected based on nearly 100 survey responses from the user community collected over the past year, coupled with a desire to provide search services from a Google-like text box. Much like Google, a single search box takes search criteria, and then scans through all aspects of the archive’s metadata to find and rank results in the order of relevance. Seasoned users of the NRAO archive can find familiar search forms and functionality through the links half-way down the page (“Basic VLA & VLBA Data Retrieval Tool”, “Advanced Query Tool” and “Image Archive Tool”).
All new search features are available through the Google-like search box prominently located on the front page. To search the NRAO archive, simply submit terms which characterize what you seek (e.g. observer, source, project …) into the box. The search tool also accepts cone searches in RA and Dec (currently in decimal degrees) with a radius in the format r:0.25, for example, which will search the area of a quarter of a degree around the specified location.
After pressing enter or clicking the button that says “NRAO Archive Search”, you will be taken to the “Search” tab where your results will appear. This can take less than a second for simple searches such as your name or project code, or 20-30 seconds for more complex searches of two or more terms. From the results page, you can:
- Download all available raw datasets from VLA and GBT, and calibrated datasets available through the image search;
- View the proposal cover sheet information for most GBT projects and VLA projects since 2006, which includes details about project team members;
- View available Scheduling Blocks from GBT observations conducted between 2004 and early 2007 that are beyond their proprietary period;
- See the optical background in the search region as seen using Google Sky;
- Run an image search on the same region to see if there are any calibrated datasets or pipeline processed images available.
The search uses a filtering mechanism to let you drill down to the specific data you seek. For example, if you search on your last name, you will find all results observed by you. If you click on a project code, you will go to all the matches for that project code that also match your name. If you click further on a year, you will go to all the matches for your name and project identifier which also match the specified year. To reset the search form, click on the “Data Vault Home” tab at the top of the screen. When you find a dataset that you want to download, click the green download arrow. Files that are selected for download are placed in a holding area that functions like an online “shopping cart” accessible from the “Download” tab.
Tips and tricks:
- To search VLA projects by legacy ID, you may need to put a leading zero in the number (e.g. use AH0862 instead of AH862).
- To search for pulsars, do not include a space between “PSR” and the rest of the source name (e.g. use PSRJ2145-07 instead of PSR J2145-07).
- The search does not require complete words to match results. A search of “J2145” for example will match J2145-07, PSRJ2145-07, J2145-0750, J2145+11 and J2145+1115. As another example, a search on “vesta” will find observations of the asteroid as well as observations done by Jim Ulvestad, who has an asteroid embedded in his last name.
- More help files and tutorials will be available; this collection will grow as new features are available through the Data Vault.
Although the new interfaces have been released, work will continue on updates and new additions to the search capabilities throughout the summer and fall. Some needs are subtle, while others are substantial (for example, VLBA data is not available from the main search box yet, but is available from the “Basic VLA & VLBA Data Retrieval Tool” linked to the main archive page). Feel free to provide feedback on all issues, small and large, that would help us make the archive more useful to you for your research.
We rely on feedback from the user community to continuously improve not only our search capabilities but also our archive content. In addition to the online survey that can be accessed by clicking “Provide Feedback to the Developers” on the archive home page, support is available from the Data Vault helpdesk which can be contacted through datavault@nrao.edu.
Nicole Radziwill
VLBA Principal Scientist Appointed

Jim Ulvestad
I am very pleased to announce that Jim Ulvestad has agreed to serve as Principal Scientist for the VLBA. In this position, Jim will bring his well-known expertise and eloquence to bear as the primary science advocate for the VLBA to the astronomical community. Outreach to scientific communities lying beyond NRAO's traditional VLBI user core will be a major focus of his efforts.
This work is a natural extension of Jim's ongoing efforts as head of NRAO's New Initiatives Office, to develop funding and other operational partnerships for the VLBA.
Bob Dickman
The GBT Supports the Phoenix Mars Lander Mission
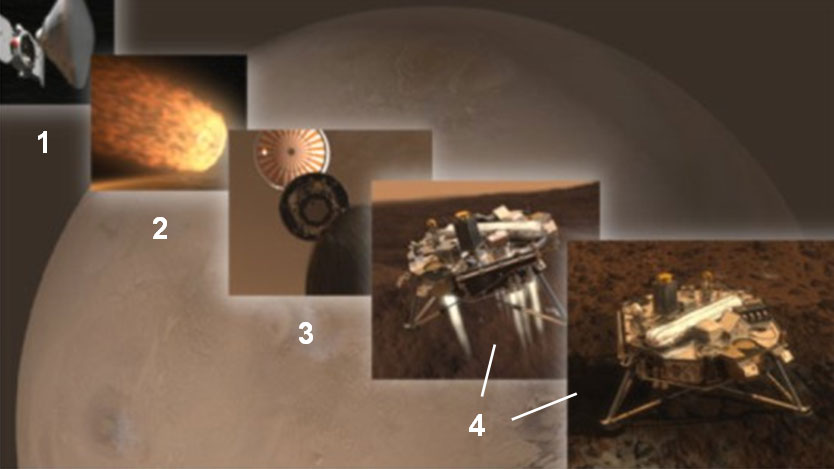
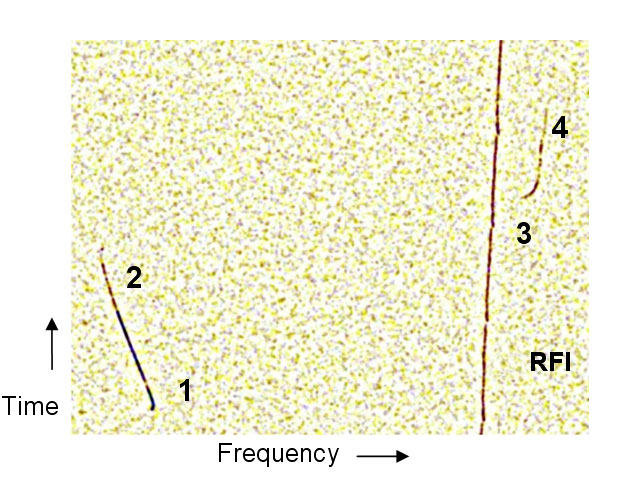
Numbered panels in Figure 1 correspond to changes in the GBT signal shown in Figure 2:
(1) Phoenix separates from its cruise vehicle and turns on its transmitter.
(2) The frequency, which had been slowly decreasing due to the Doppler effect of Phoenix’s free fall towards Mars, now increases rapidly (from 2 to 3) as atmospheric friction slows the spacecraft from 20,000 to 900 mph.
(3) The parachute deploys, slowing Phoenix to ~ 200 mph.
(4) The parachute is jettisoned, and the retrorockets fire, bringing Phoenix down to a soft landing on Mars.
The Green Bank Telescope (GBT) supported the successful landing of the NASA Phoenix Mars Lander on May 25, directly observing radio frequency transmissions from the lander. Phoenix is the first spacecraft to land in Mars’ polar region and study its landscape, subsurface ice, and minerals.
NASA’s Mars Polar Lander failed in 1999 due to a software glitch that caused the landing rockets to shut off prematurely. Lessons learned from that mission helped make Phoenix a success. NASA placed great importance on monitoring Phoenix via multiple channels throughout the critical atmospheric entry, descent, and landing (EDL) sequence.
Phoenix was designed to transmit data to one or more of the three satellites orbiting Mars: Renaissance, Odyssey, and Express. These orbiters relay data at X-band to one or more of the Deep Space Network (DSN) 70-meter antennas in California, Australia, and Spain.
For the critical EDL sequence, NASA wanted to also monitor the signals directly from the spacecraft. Only the 100-meter Robert C. Byrd Green Bank Telescope is sensitive enough at the frequency (~ 401.6 MHz) of Phoenix's faint signals from Mars to accomplish this vital direct monitoring task.
If a malfunction occurred during EDL, GBT data would be vital to the subsequent analysis and diagnosis. Fortunately, everything worked correctly. The GBT data are now being integrated with orbiter data to improve our knowledge of the spacecraft’s trajectory, an important input to future mission planning.
GBT staff, including Gary Anderson, Frank Ghigo, Toney Minter, Roger Norrod, and Galen Watts, began preparing for the Phoenix mission in December 2007. They have collaborated with radio science experts Peter Ilott, Sami Asmar, and Sue Finley from NASA's Jet Propulsion Laboratory (JPL), veterans of planetary exploration missions, including the Mars Rovers, Spirit and Opportunity.
The JPL scientists integrated their own sensitive sampling and data recording equipment with the GBT. NRAO Electronics staff Dave Woody and Nathan Sharp helped set up and connect the JPL equipment. Computer staff Chris Clark, Wolfgang Baudler, and Gene Runion were essential in connecting the JPL equipment to the Internet such that GB data displays could be seen at JPL.
During tests in December 2007 and March 2008, the GBT observed signals from the Mars rovers, which transmit at the same frequency and at a similar power level as the Phoenix lander. Shortly before the March tests, problems with the cryogenics of the GBT prime focus receiver were discovered and repaired, with the expert help of electronics and cryogenic technicians Jonah Bauserman, Bob Simmons, and Kenny Lehman. The March tests were successful, though some interfering signals were detected which, if they occurred during the Phoenix EDL, would obliterate the data being collected.
To identify the radio frequency interference (RFI) source, the GB Interference Protection Group (Carla Beaudet, Wes Sizemore, and Paulette Woody) swung into action. They researched and analyzed Earth-orbiting satellites that might interfere and monitored the local area for possible local RFI sources. They also contacted spectrum managers at NSF, NASA, and other agencies. Two Earth-orbiting satellites that would have caused serious interference were identified. The managers of these satellites agreed to turn them off during the critical Phoenix observing period.
Education Officer Sue Ann Heatherly organized public education and outreach events for the Phoenix EDL. A video link was established from GB to the Clay Center for Arts and Sciences in Charleston, WV. Peter Ilott gave a GB colloquium on "Listening to Mars" that was transmitted to the Clay Center. The video link from the GBT Control Room to the Clay Center was available throughout the EDL sequence, as was a streaming video feed to the Internet. Computing staff Chris Clark, Carolyn White, Charlie Myers, and Steve Tritapoe established the video/audio links; Taylor Johnson and Mark Adams assisted with the webcast.
The GBT Control Room was crowded as Phoenix’s entry into the Martian atmosphere, descent, and landing took place between 07:00 and 08:00 p.m. EDT on Sunday, May 25. The JPL scientists operated their recording equipment; GBT telescope operators Barry Sharp and Eric Knapp were on duty; and Frank Ghigo made sure that the GBT accurately tracked Mars. Software, receiver, microwave, and mechanical engineers were on hand and ready to resolve any last-minute technical problems: Bob Anderson, Gary Anderson, Roger Norrod, Steve White, Joe Brandt, Mark Whitehead, and Mike McCarty. Interference sleuths Carla Beaudet and Wes Sizemore checked for RFI. Bill Saxton operated the video camera, and Chris Clark monitored the Internet feeds.
Green Bank summer students Anthony Woody, Colin Slater, Stephanie Moats, and Marc Eimers shared in the excitement. An electronics engineer from Ohio, Rick Hunter, who had designed communication equipment on Phoenix, was visiting. Heather Niday reported for the local radio station, WVMR, and newspaper, The Pocahontas Times. Members of the Central Appalachian Astronomy Club had "front row" seats.
The Control Room videocast was viewed and enjoyed by visitors to the GB Science Center and the Clay Center. Both auditoriums were filled to capacity. Sue Ann Heatherly and Toney Minter provided running commentary for the remote audiences, interviewing scientists and engineers, and answering questions. Peter Ilott was continuously on the telephone with the JPL control center; he called out the EDL events as they happened. Sue Ann repeated the information for the science center and webcast audiences.
The signal from Phoenix as received by the GBT appeared at the expected time. The signal displays from two JPL data recording devices were also transmitted to Pasadena in real time for Phoenix mission controllers.
Changes in the GBT signal strength and Doppler shift demonstrated that Phoenix was moving through the fast and exciting EDL sequence, entering the atmosphere, decelerating, deploying its parachute, firing its retrorockets, and finally landing on the Red Planet. When a safe landing was confirmed, sustained applause broke out!
Everyone at the NRAO, whether in the GBT control room or elsewhere, was pleased and proud that we had participated in this new phase in the exploration of Mars.
To learn more about the Phoenix mission, visit the web site.
Frank Ghigo
Satellite Downlink Coordination & the GBT Phoenix Mission
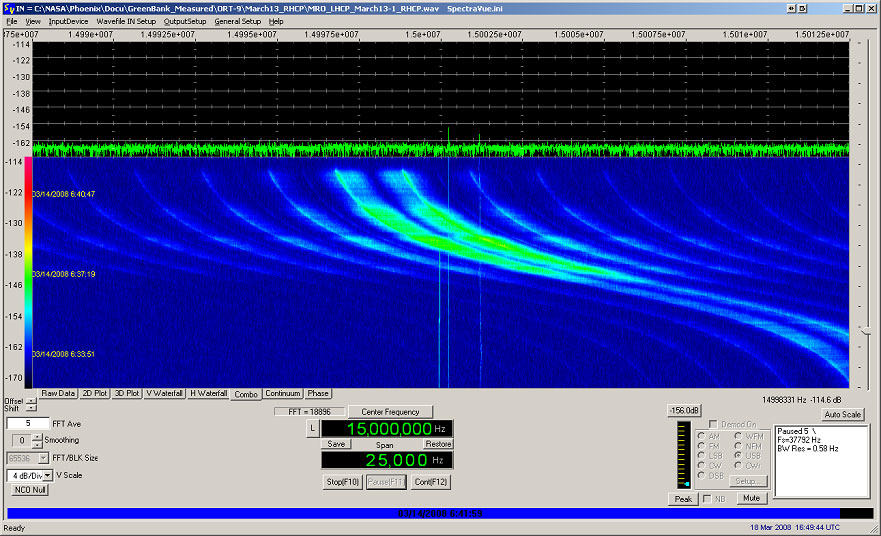
Figure A: Interference from a Low Earth Orbit (LEO) satellite on March 13, 2008 showing Doppler shift.
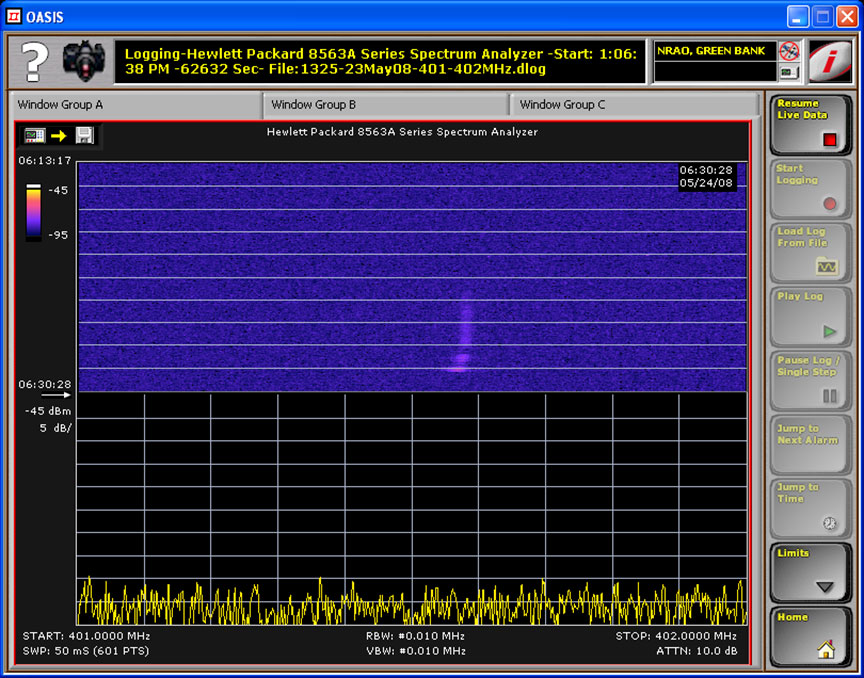
Figure B: A LEO satellite turned off its downlink during this May 24 pass over Green Bank in preparation for the May 25 Phoenix Mars landing.
On March 13, 2008, a team from the NASA JPL Phoenix Mars Lander Project visited NRAO Green Bank to conduct a trial run in preparation for the May Entry, Descent, and Landing (EDL) phase of the Phoenix Mars Lander Mission. The Phoenix Lander has been designed to conduct studies of subsurface ice and soil composition near the Martian north pole.
The JPL team sent to Green Bank, headed by Peter Ilott, used the GBT to directly receive a UHF signal from the Phoenix Mars Lander on May 25. During the March 13 Operational Readiness Test (ORT-9), though, the GBT was looking for a signal at the same UHF frequency (401.56 MHz, topocentric) from the Spirit Mars Rover.
Just before Spirit crested the Martian horizon, very strong interference marched across the observational band, obliterating everything within about 30 kHz of its center frequency, which shifted about 20 KHz and then disappeared within about 11 minutes. About 30 minutes later, a second interferer with a similar signature was seen. Given the observed Doppler shift, these could only be Low Earth Orbit (LEO) satellites. A closer look at the data revealed a different modulation frequency for the two interferers, so it was clear that there were at least two orbiters that could potentially cause problems. How many more were there?
A comprehensive list of satellites by downlink frequency is not easy to come by (If you know of one, please send a link to interference@nrao.edu.) The GB RFI group — Carla Beaudet, Wesley Sizemore, Paulette Woody — consulted their spectrum management contacts at the NSF and at the quieter agencies that prefer not to be mentioned. Feiming Morgan, a NASA/JPL spectrum manager, also sought LEOs with downlinks between 401 and 402 MHz, finding one that was on a particularly critical interference path. Many 2-Line Orbital Element Sets later — 2-Line Orbital Element Sets enable satellite orbit prediction — the GB RFI group was putting in odd hours monitoring satellite passes.
In the end, coordination with the Los Alamos National Laboratory and Sandia National Laboratories was critical to the GBT receiving the EDL signal from the Phoenix Mars Lander. Had this coordination not occurred, approximately 12 minutes of the critical 14-minute landing window would have been lost to interference. The Mars orbiters would still have received and relayed the Phoenix telemetry, but the Doppler information from which, e.g., Martian wind speeds can be deduced would have been lost, as would the GBT signal that was the first indication of a successful landing.
C. Beaudet
The Pete V. Domenici Science Operations Center
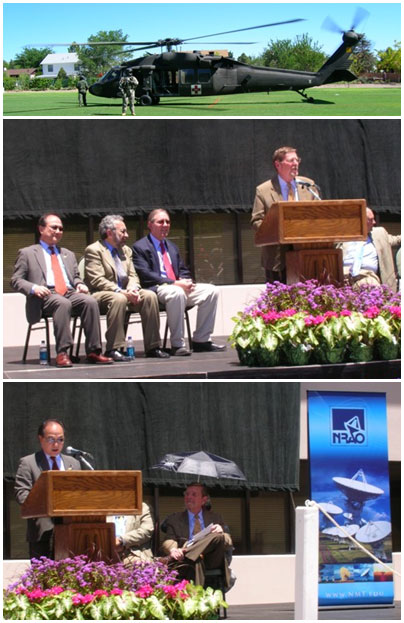
The NRAO's Array Operations Center in Socorro officially became the Pete V. Domenici Science Operations Center in a ceremony attended by its namesake on May 30. Pete Domenici, New Mexico's longest-serving U.S. Senator, is retiring next January after 36 years in the Senate. A longtime supporter of NRAO and of science in general, Domenici was instrumental in putting together the state-Federal deal that funded the building's construction more than 20 years ago. Over the years, his strong advocacy was essential for the success of the VLA, the VLBA and the EVLA project.
The building's new name "recognizes the strong and effective support for science that has been a hallmark of Senator Domenici's long career in public service," said NRAO Director Fred Lo. "Our observatory has had no better friend and champion than Senator Domenici. To a very great extent, the tools we have provided and will provide to the world's astronomers are a result of Senator Domenici's longstanding and steadfast support," Lo added.
Originally dedicated in 1988, the Pete V. Domenici Science Operations Center houses offices and laboratories that support VLA and VLBA operations, in addition to EVLA and ALMA development.
The May 30 ceremony featured remarks by Lo, AUI President Ethan Schreier, Cambridge (UK) University's Physics Department head Peter Littlewood, and Van Romero, Vice President for Research and Economic Development at New Mexico Tech. The building sits on the NM Tech campus and is owned by the university. The ceremony was a joint effort of the two institutions.
Sen. Domenici, in his remarks, reiterated his support for research as a vital part of the nation's future, and praised NRAO and NM Tech for their efforts and their cooperation.
At the close of the ceremony, Domenici, Lo, and Romero jointly triggered small explosive charges that cut the ropes on a large curtain, dropping the curtain and revealing the new name on the building's front wall.
The day began with a tour of NM Tech's Magdalena Ridge Observatory atop South Baldy, southwest of Socorro and 10,400 feet high. Sen. Domenici, along with NRAO and NM Tech visitors, saw that facility's 2.4-meter telescope and the building that will house the beam combiner for an optical interferometer. The party then returned to the NM Tech campus aboard Blackhawk helicopters provided by the NM National Guard.
David G. Finley
NRAO Scholarships Awarded
Two astronomy students from the Universidad de Chile — Andrea Silva and Cinthya Herrera — were awarded scholarships by the NRAO to attend the Eleventh Synthesis Imaging Workshop in Socorro, NM, from 10 - 17 June 2008. These students were selected by the NRAO scholarship commission: Mónica Rubio, representing the National Council of Scientific and Technological Investigation (CONICYT); Andreas Reisenegger, President of the Chilean Astronomical Society (SOCHIAS); and Eduardo Hardy, NRAO/AUI representative in Chile.
Both students have an undergraduate degree in astronomy and are presently graduate students at the Universidad de Chile. Silva has completed her studies at this institution and is finishing an MSc thesis on massive star formation related to the accretion process in dense massive galactic nuclei. Herrera is starting the first year of her graduate studies. She was an undergraduate student at the Pontificia Universidad Católica de Chile where she worked with millimeter wave data from the Large Magellanic Cloud.
Silva and Herrera are interested in advancing their studies in radio astronomy, and the Eleventh Synthesis Imaging Workshop is a unique opportunity for them to do so. Silva is interested in interferometric data reduction and observations, and is looking forward to ALMA. Herrera is interested in VLA data and, in particular, the practical tutorials that she will attend at the Synthesis Imaging Workshop.
Sergio Cabezon
ALMA Presentations in Chile

Mauricio Pilleux with students from the Italian School in Santiago, Chile.
Mauricio Pilleux, NRAO Chilean Business Manager and North American ALMA Deputy Project Manager (Technical), has recently given several talks about ALMA for members of the public in Chile, including doctors, university, and school students in the cities of Valdivia and Santiago. These public talks described the ALMA mission, science, and job opportunities, as well as NRAO science and programs outside Chile.
For students from the Engineering Sciences Faculty at the Universidad Austral de Chile, Mauricio presented a talk titled: "The ALMA Radio Telescope: Challenges and Opportunities." Located in southern Chile, Valdivia is the capital of the newly created Los Ríos Region, the capital of Valdivia Province, and the home of the Universidad Austral de Chile, founded in 1954.
Mauricio delivered a second presentation in Valdivia titled "ALMA, its technology, and the borders of the Universe" for a group of doctors from the Regional Base Hospital as well as an especially enthusiastic group of students, professors, and parents from the German School in this city. Mauricio also presented this talk in Santiago to primary and secondary students from the Italian School.
Sergio Cabezon

The National Radio Astronomy Observatory is a facility of the National Science Foundation operated under cooperative agreement by Associated Universities, Inc.
Copyright © 2009 Associated Universities, Inc.